Greetings!
Hoping that the first blog was able to get you thinking on practical ways to get started with Data Analytics without disrupting your Core Work?
In this blog, we look at how to use process knowledge to determine the type of equation or relationship that will be there between a Key Performance Indicator and Factors that influence the indicator.
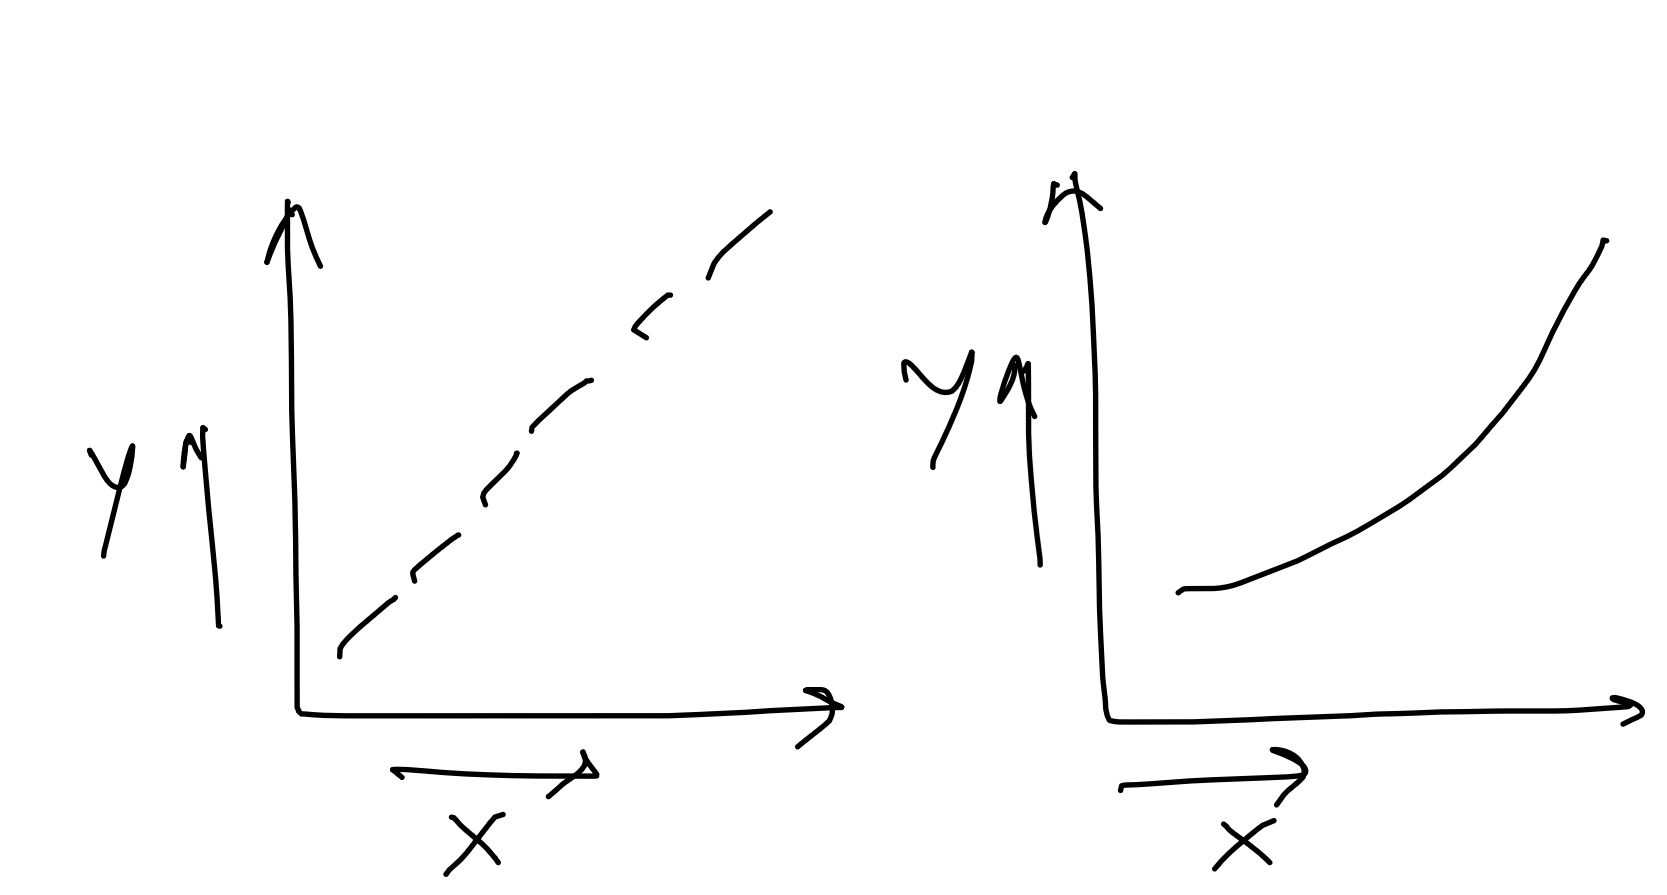
Linear Relationship
Heat Transfer, H= M x C x DeltaT is a perfect example of linear relationship between and indicator (Energy/Heat) in this case with its variable (DeltaT, assuming mass flow rate and specific heat capacity to be constant).
Energy will always be directly proportional to DeltaT and will change by same degree as does DeltaT. Whenever we see similar relationships, we should always opt for a linear equation.
Some caveats, in most real-life cases, there will be influence of other variables/factors on the chosen KPI and a linear relationship (even multivariate, will talk about it later) may not be an appropriate answer.
Non-Linear Relationship
Most of the energy performance indicators (EnPIs) or even other KPIs we use to assess energy performance, health of assets etc tend to have a nonlinear relationship, meaning that change in one variable may not have the same degree of change on the indicator. Some examples?
- Energy vs Occupancy
Energy Consumption of a building will never be directly proportional to occupancy, however for sake of clarity most textbooks or M&V guides will use a direct relationship.
- Specific Energy Consumption (or COP) vs Capacity Utilisation
COP of a Chiller/ Cooling Tower (either as an individual asset or as part of the network) will always have a nonlinear relationship with capacity utilization.
Towards the lower side of CU%, even a small change can lead to significant change in COP/SEC and on the higher side, even significant change in CU% may not lead to a significant change in COP/SEC.
Multivariate Relationships
This is where things get slightly complex (but the Black Box approach described in the first blog will always come in handy). In most of the real-life scenarios handling assets like Chillers, Cooling Towers, Air Handling Units etc, you will encounter that an indicator does not only depend on one variable but on more than one variable.
Let’s again take the example of COP. It not only depends on CU% but also on the ambient conditions, and if we were to make it more complex (which is something we will have to consider as we progress further) we could even add Health Index as a variable.
This is where no one can beat you in your game, as Operations & Maintenance Engineers, you have an amazing understanding of how assets operate and what influences the overall performance. Believing in that and taking a black box approach can go a long way in leveraging data analytics.
In the next blog, we will discuss on assessing data quality and then we will take up examples on forming equations and generating forecasting models.
Have questions/feedback/suggestions or you may as well want to participate in this endeavor? Feel free to write to me at umesh(at)energytechventures(dot)com(dot)au
Best Regards,
Umesh