Hello Everyone!
This blog post has been on my mind for a long time and every since i forgot my notebook in the flight to Melbourne, release of this post got all the more delayed.
Over the last year I’ve had the opportunity to meet a lot of O&M engineers from across different #FacilitiesManagement companies. One of the common question most people had was "How can we get started with #DataAnalytics in the most convenient manner?" Good question!
Here is a practical guide to steps you must take to begin your journey of using #DataAnalytics to improve the way you do your work now and to do it in a way that's Faster, Better and Effective.
Step 1: Think of the number 1 problem you want to solve (relatively easy, from the daily tasks you do)
For example if you are into HVAC operations and maintenance, and would like to know about the health or performance of the "Cooling Coil" of a particular AHU but with nothing that you currently have provides you that information, or not in a manner that’s Faster, Better and Effective.
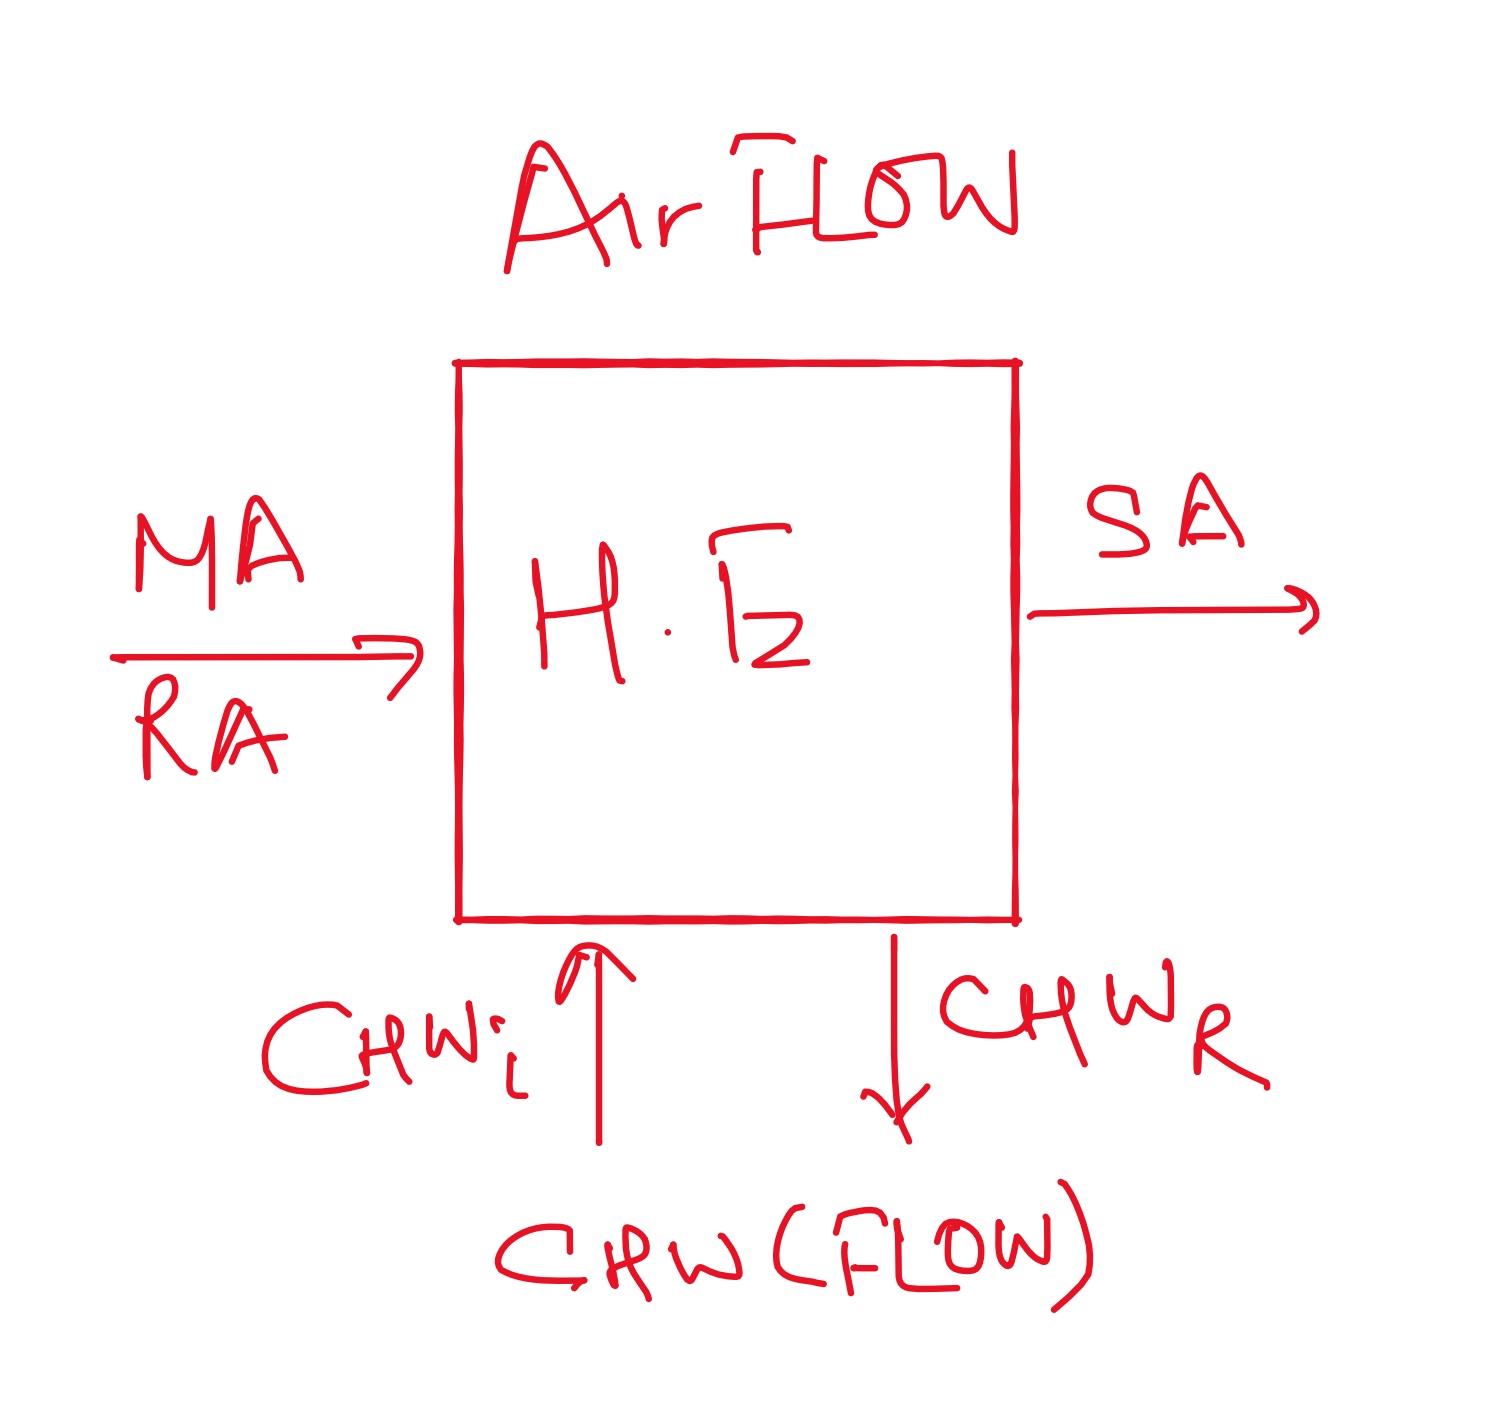
Step 2: Draw a black box, isolate that asset/part of the asset from the entire network
Continuing from the example above, let's say we want to find out about effectiveness of the cooling coil of Air Handling Unit Number 6. In that case we have to isolate not just the AHU but the "Heat Exchange" section where the heat exchange takes place between Return/Fresh/Mixed Air and Chilled Water to get the desired temperature of the Supply Air.
Isolation should be done in a manner that you can draw up in a simple diagram, what's coming in?, what's going out? and what's happening in between.
Step 3: Identify the Critical Success Factors and Key Performance Indicators
Once you would have drawn the black box, next step is to find out which variables influence the performance of the "KPI". You have to carefully select that one variable, in this case we would choose Delta Temp (Chilled Water) and the important factors to go along with.
Step 4: Develop an equation for KPI as a function of the Critical Success Factors or CSFs chosen in step 3.
Refer article on Wikipedia for more details https://en.wikipedia.org/wiki/Equation
This is where we have to use our "engineering" principles and define what kind of equation would it be? There can be many, like for example in this video (https://www.youtube.com/watch?v=TkiB1xBnjn4) you can see how to do a linear regression in excel, generate a linear forecasting model like y=mx+c.
There you go, you've got started with Data Analytics. Easy, isn’t it?
In the next blog as part of this series, we will talk about the ways in which we decide to choose the equations between different variables.
What problem did you solve today?
If you have a specific problem and would like us/our team to help you get over the line, do not hesitate to email us your request at connect@enview.com.au.
We are also releasing EnView Mobile App which will have a host of tools designed to help you in your daily tasks so that you can do them in a manner that's Faster, Better and Effective!
Want to sign up to access the first release? Email us at connect@enview.com.au with the subject "Mobile App" and we will have it available for you
Happy Analysis!
